🛠
BetaDiagram is a subset of BetaGraphic
How is Risk visualized? Percentage?
Metromap
Treeview of Complexity
EinsteinSpaghetti Timeline of instances
Network of interacting elements. Network can extend to the opposite side of the piece if looking at a landmark, don't limit the instance by space, only by time
Line width is Beta.Kratos
Nested along a via line
Each Subsystem is an ImageLayer. How are shown all at once?
Interactive Diagram can happen in a static website. How to make them work for every screen size?
How to layer network of influence over cartographic? Beta over land
Don't show all BETA, chunk, scoped, highlights, error, injury, event ends
Repetitions of planting instance
Planting moment is the spacetime unit At this moment what elements are being used and with what state?
State is all the values. An element is a Kanon, template, holding structure, framework. Pokémon card Kanon
Are there any history of pokemon cards or playing cards
Use Pokemon as an analogy for system and element. Each character is a variation on a Pokemon Kanon.
State is Nondual.
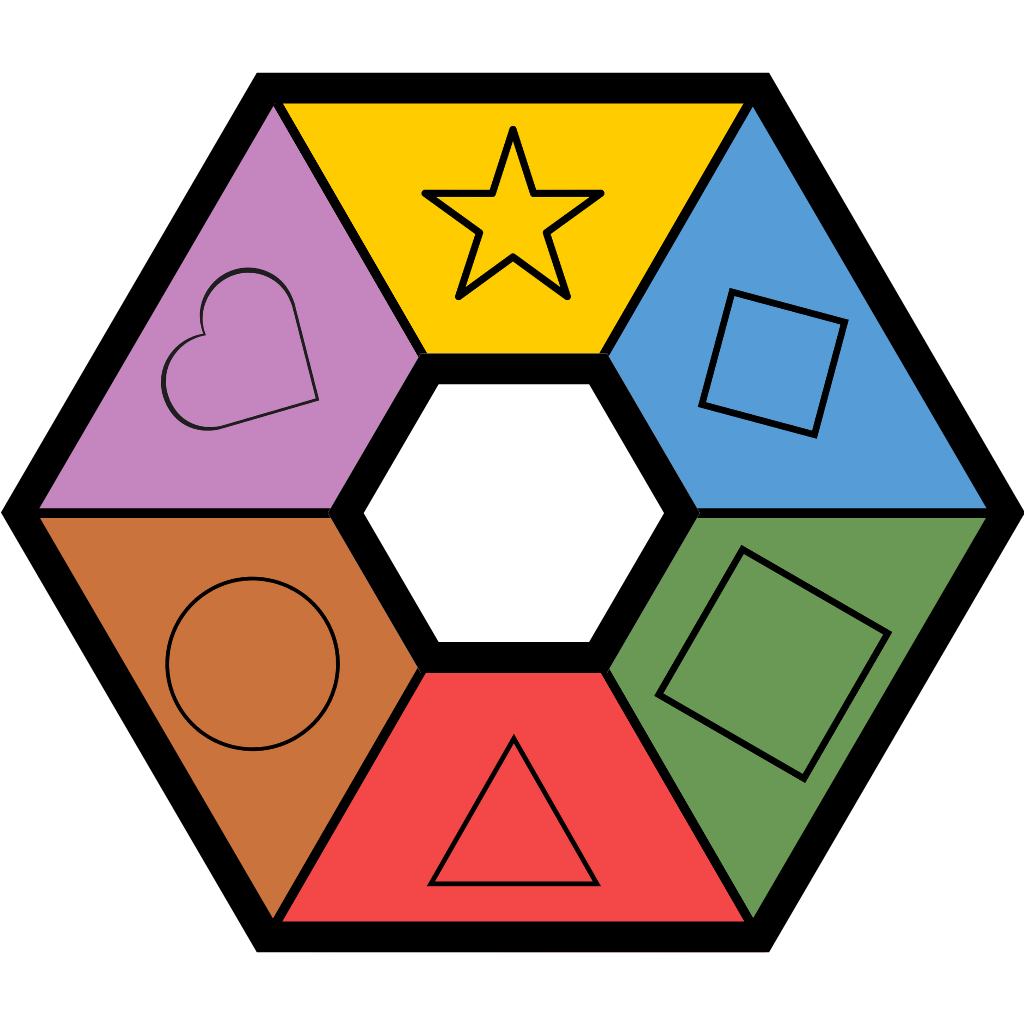
ColorCode
Use the module colors along with their icons
🌈
🔷
🟩
🔻
🟠
💜
Betaglot Docs
For a beginner, how do Vue and Python docs suck?
No images of humans at a computer. It doesn't even need to be technical, just an image to show explicitly that people use this system, it's not just some abstract thing
🛠 &&&
ScaleBar
Have a BetaGraphic of your piece with recommended Line VIA-Path.
Arrow of Attention is Violet
AttentionLoop
- EKOS, then ANIMA, then MOTOR, then VIA, then back to EKOS.
"Beta.BetaCard"
"Beta.BetaTimeline"
